Ofsted, SIAMS and Performance Data
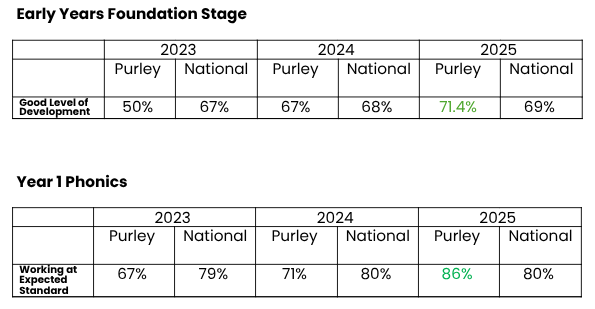
The tables below show how Purley’s results compare with the national average. With our small class sizes (6–7 children in recent Reception and Year 1 cohorts, and a maximum of 15 children in KS2 cohorts), each child’s results have a greater impact on overall percentages.

Year 4 Multiplication Tables Check
The Multiplication Tables Check (MTC) is a short assessment taken by Year 4 pupils to measure their knowledge and recall of multiplication tables up to 12.
The MTC consists of 25 questions, and students have six seconds to answer each one. The check is completed online in school, and helps teachers identify areas where students may need extra support.

Key Stage 2
At the end of Year 6, most pupils take the National Curriculum tests (SATs) in reading, maths, and English grammar, punctuation and spelling. These tests are marked externally and help measure both pupil progress and school performance.
Writing is assessed separately by teachers, using a national framework. These assessments are regularly moderated by the Local Authority to ensure consistency and accuracy.
While SATs provide a useful snapshot of academic achievement, they don’t capture the full picture of each child’s progress, creativity, and resilience. With small cohorts (typically up to 15 pupils), results can vary year to year depending on individual needs and circumstances.
Our results inform our ongoing School Development Plan (SDP) and reflect just one aspect of the rich, well-rounded education we provide.
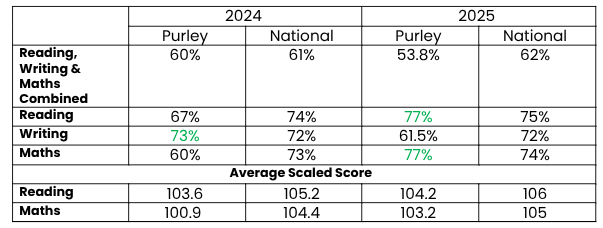
Below is a summary of our most KS2 results from July 2025, with the previous year and national figures for comparison:

Please find below our most recent SIAMS (Statutory Inspection of Anglican and Methodist Schools) and Ofsted reports.
See below for useful links for comparison of data
